Background
There are many articles on reading the source code of TiDB, often referred to as the “Twenty-Four Chapters Scriptures”. However, these introductions typically proceed from a macro to a micro perspective. This series attempts to introduce how to read TiDB’s source code from an easier angle. The goals we aim to achieve are:
- Enable readers to start reading TiDB’s code themselves, rather than understanding it passively through pre-written articles.
- Provide some common examples of looking into the details of the code, such as examining the scope of a variable.
After all, teaching people to fish is better than giving them fish. While the code changes often, the methods remain mostly unchanged.
Why choose TiDB to read?
I am not familiar with TiKV or PD.
TiDB is the entry point directly interacting with users and is also the most likely to be questioned.
TiDB can run independently and be debugged. If you want to run some SQL after reading the code to verify your understanding, it can be easily done.
Preparations
A development machine
TiDB is a pure Golang project. It can be conveniently developed on Linux, MacOS, and even Windows. My environment is Windows 10.
A copy of the TiDB source code, available for download at the official repo.
Golang environment, following the official guide is straightforward.
Goland or IntelliJ IDEA + Golang plugin
I personally feel there’s no difference between the two. Why not recommend VSCode + Golang plugin? Mainly because I’m used to the JetBrains suite, and indeed commercial software tends to be higher quality than community software. For long-term use, it’s recommended to pay for it. Students can use it for free, but need to renew the license every year.
Environment Setup
After installing the Golang environment, remember to set the GOPATH, which is usually:
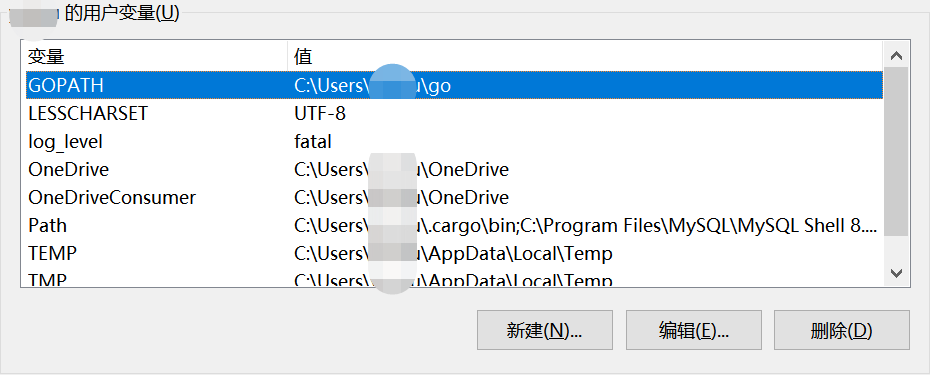
The TiDB code doesn’t need to be developed under the GOPATH, so you can place it anywhere. I usually create a directory called work and throw various codes in there.
Open Goland/IDEA. I use IDEA because I often look at code in other languages.
Open with IDEA, select the tidb directory.
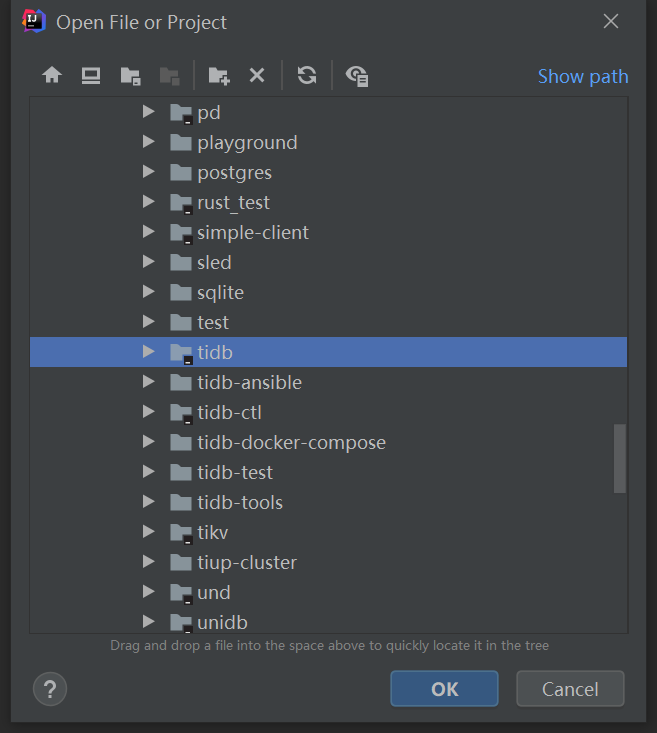
At this point, IDEA typically prompts you to set up GOROOT and enable Go Modules. Follow the recommendations.
The environment setup is now complete.
Entry Points
At the beginning, someone advised me to start with the session package. However, after some experience, I personally feel there are two better entry points: the main function and the dispatch function.
main Function
The main function of TiDB can be seen at link. You can roughly go through what happens when starting a tidb-server from top to bottom.
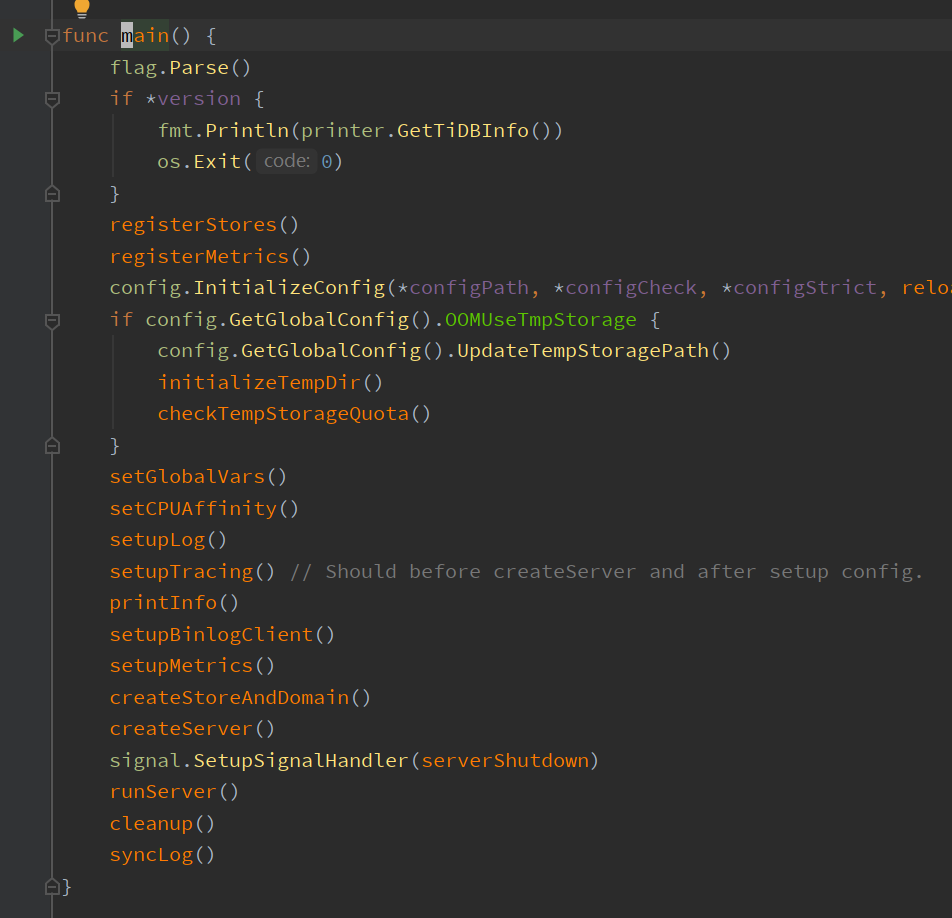
From top to bottom:
Parse flags
Output version information and exit
Register store and monitoring
Configuration file check
Initialize temporary folders, etc.
Set global variables, CPU affinity, log, trace, print server information, set binlog, set monitoring
Create store and domain
The
createStoreAndDomainmethod is important, as critical background threads are created here.Create server and register stop signal function
Start the server
Within
runServer, thesrv.Run()actually brings up the tidb-server.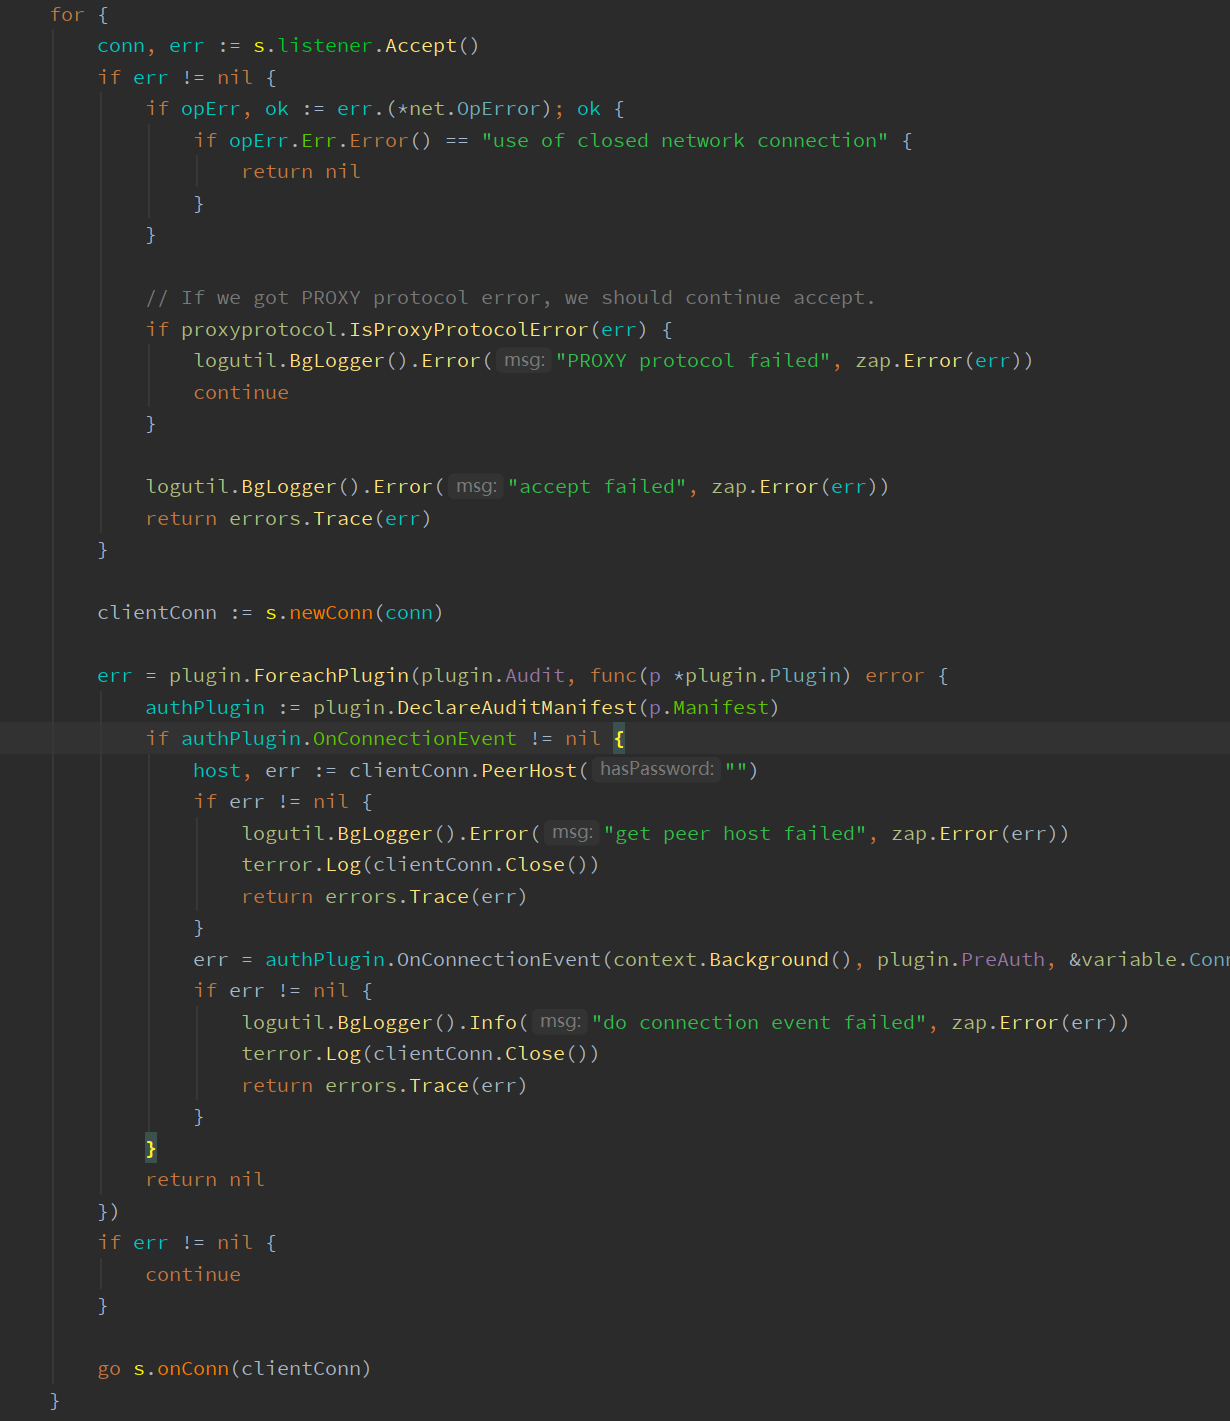 In the
 Run()function here, the server continuously listens to network requests, creating a new connection for each new request and using a new goroutine to serve it continually.After this, cleanup work is done when the server needs to stop, ultimately writing out the logs.
Thus, the entire main function process ends. Through the main function, you can see the complete lifecycle of a server from creation to destruction.
Additionally, with IDEA, you can easily start and debug TiDB. Click on this triangle symbol as shown in the image below:
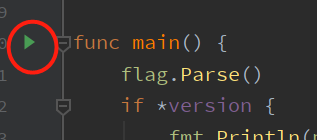

A pop-up with options to run and debug the main function will appear. Essentially, this starts a TiDB with default configurations. TiDB defaults to using mocktikv as the storage engine, so it can be started on a single machine for various testing and validation.
As for how to modify the configuration for starting and debugging, this will be introduced in subsequent articles in the series.
dispatch Function
From here, we can proceed further to another suitable entry point function, dispatch.
The dispatch function has several characteristics:
Requests coming from clients only enter the
dispatchfunction, meaning from this point onward, user requests are executed. If you set breakpoints here, you can conveniently filter out SQL executed by internal threads.From here, various requests are dispatched into different processing logic, ensuring you don’t miss any user requests. It avoids situations like spending significant time reading text protocol code only to find out the user is actually using a binary protocol.
dispatchitself is located at a very early stage, meaning its parameters mostly come directly from the client’s initial information. If it’s a text protocol, directly reading parameters can parse out the SQL text.
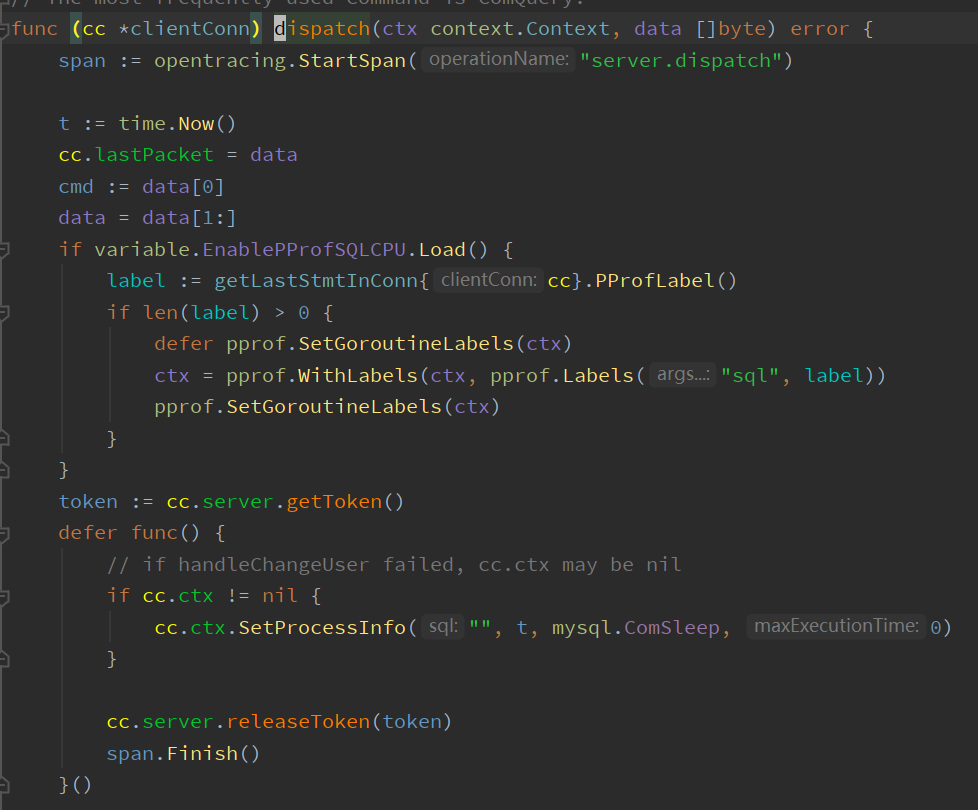
At the start, dispatch primarily focuses on obtaining tokens corresponding to the token-limit parameter. Requests that can’t get a token won’t execute, which explains why you can create many connections but only 1000 SQL executions are allowed simultaneously by default.
Next, we enter the most crucial switch case:
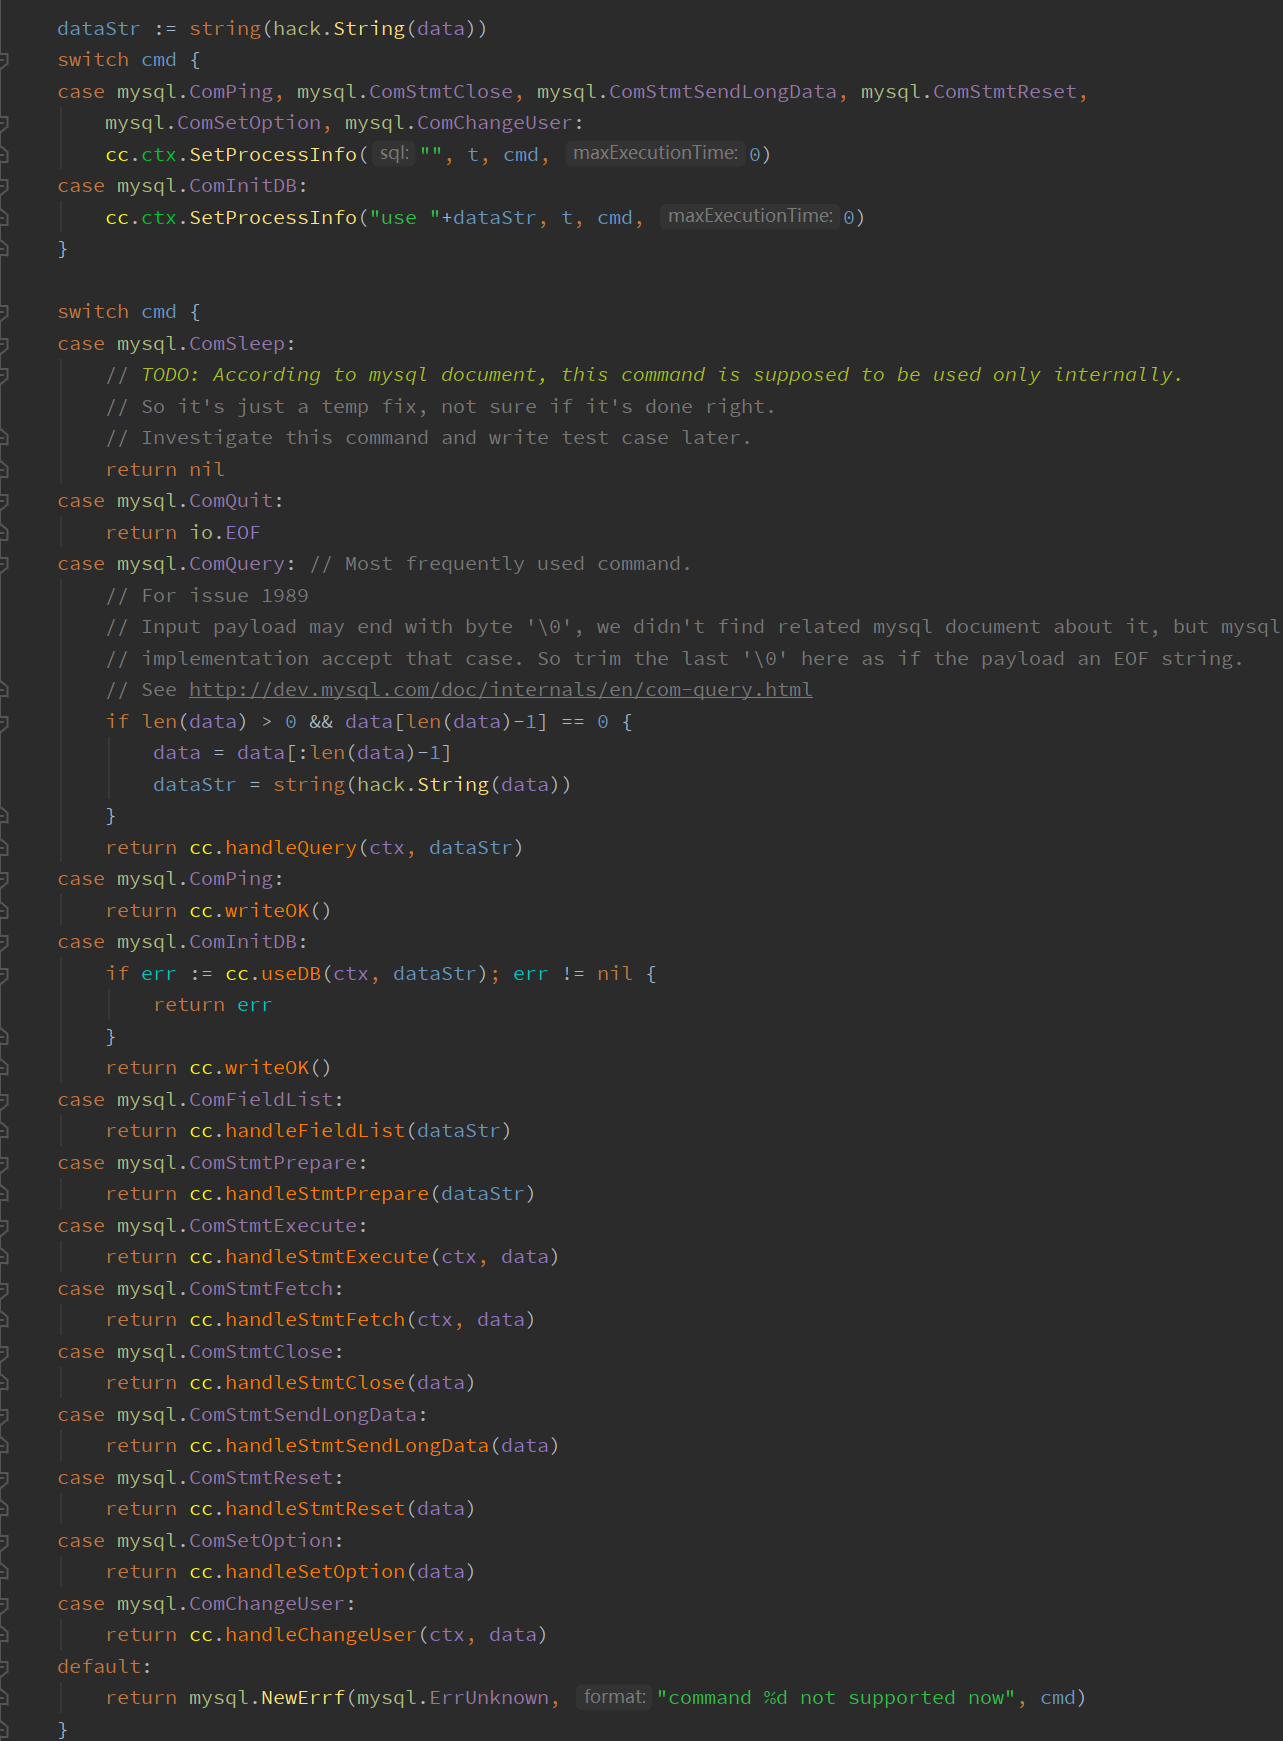
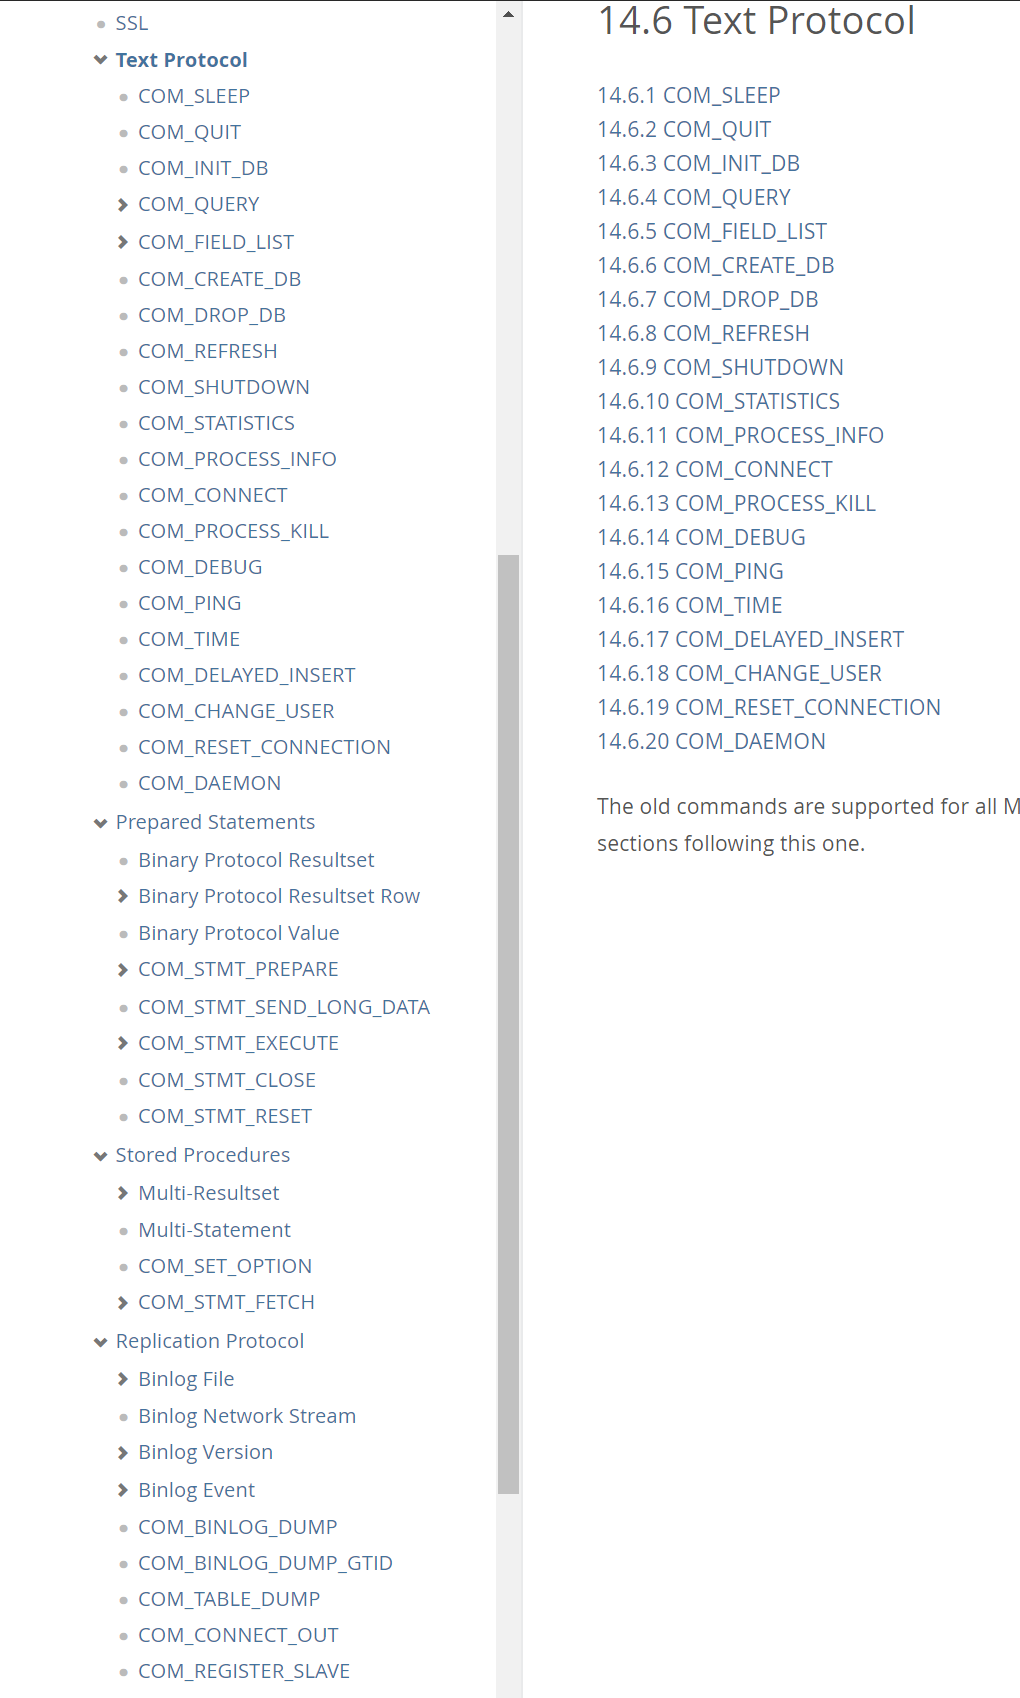
These commands are MySQL protocol commands, so it’s apparent from here exactly what TiDB implements. For comparison, you can refer to this link (this link is only for the text protocol). For full details, see the figure below:
Within dispatch, the most important are mysql.ComQuery, as well as the trio mysql.ComStmtPrepare, mysql.ComStmtExecute, and mysql.ComStmtClose. The latter trio is more frequently used in actual production, hence even more important. In contrast, mysql.ComQuery is generally used only for some simple tests and validations.
Since dispatch is the entry point for interfacing with clients, it can conveniently tally how many requests the database has handled. The so-called QPS derived from monitoring statistics is essentially the number of times this function executes per second. Here arises an issue: in cases like multi-query requests, such as select 1; select 1; select 1;, multiple statements sent together are regarded as a single request by dispatch, but as multiple by clients. While using the binary protocol, some clients prepare a statement, then execute, and finally close it. Seemingly equivalent to executing a single SQL from the client’s perspective, the database actually completes three requests.
In summary, users’ perceived QPS may not necessarily align with the number of dispatch function calls. In later versions, the QPS panel in TiDB’s monitoring was changed to CPS, which stands for Commands Per Second, representing the number of commands executed per second.
Looking at the callers of dispatch can also reveal information that helps explain some frequently asked questions:
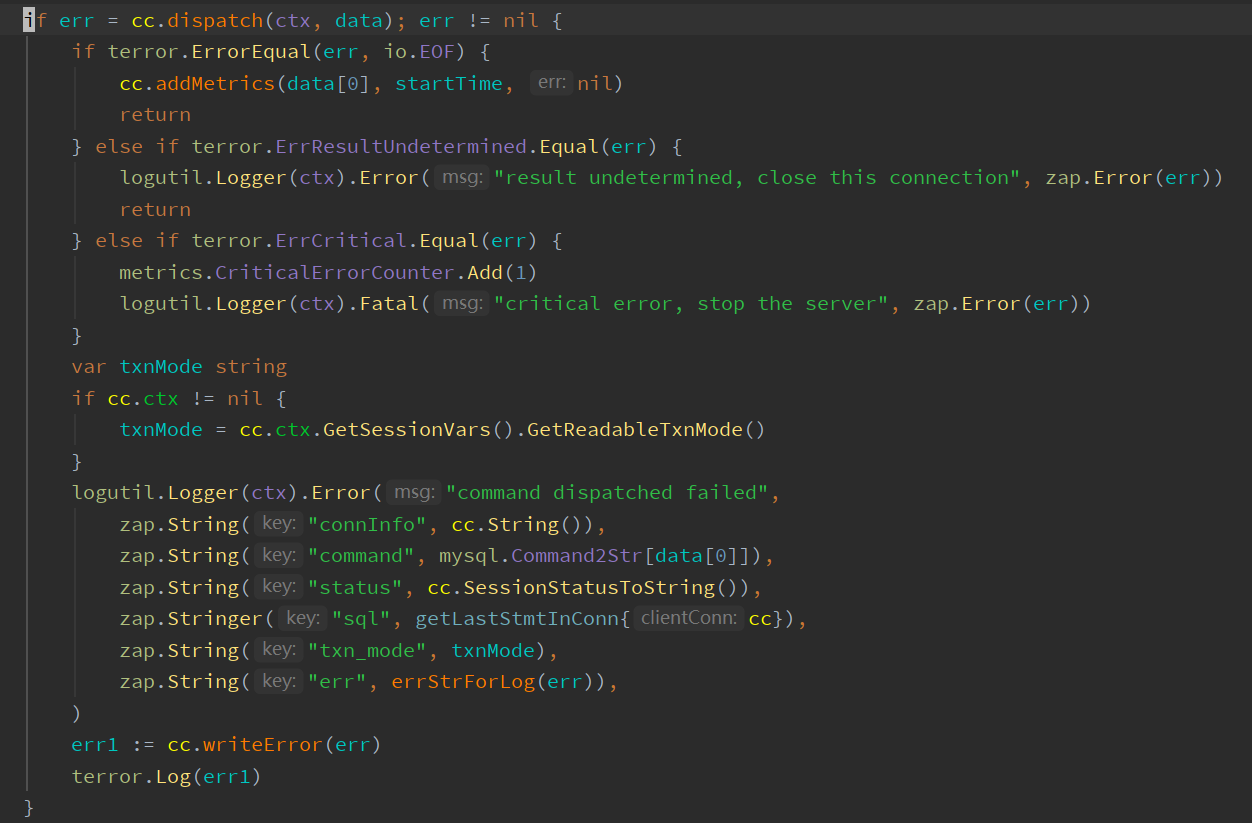
An EOF error in
dispatchtypically means the client has actively disconnected, so there’s no need to maintain the database connection, and it is severed.In case of an undetermined error (indicating a transaction’s commit is uncertain—whether it has succeeded or failed needs manual intervention for verification), manual intervention is required immediately, and the connection will be closed.
If writing binlog fails and
ignore-error = false, previously the tidb-server process wouldn’t exit but couldn’t provide services. Now, the tidb-server will exit directly.For all other
dispatcherrors, the connection will not be closed, allowing service to continue, but the failure information will be logged as “command dispatched failed”, which is arguably one of the most critical logs for TiDB.
Conclusion
This concludes the introduction from setting up the environment to finding a reasonable entry point to start reading code. Subsequent posts in the series will cover aspects such as configuration (adjustments, default values), variables (default values, scope, actual range, activation), supported syntax, etc. Stay tuned.